A Novel Approach to Cycle Analysis
Where conventional analysis often lags or falters at critical turning points, CYCLE X originates from a different paradigm. It's built upon proprietary discoveries in deep mathematical principles, largely unrelated to the standard financial modeling toolkit. We posit that these principles reveal an underlying, often predictive, structural logic within price action itself. Anticipating major market shifts requires this fundamentally distinct mathematical perspective.Our structural approach offers a unique perspective on long-term market dynamics, far beyond the scope of typical indicators or short-term models.
Validated Through Backtesting
The predictive potential of the CYCLE X model has been subjected to rigorous, multi-year backtesting across diverse asset classes (including equities, futures, forex, and cryptocurrencies) and varying market conditions.
"Strategies incorporating CYCLE X signals have demonstrated positive risk-adjusted return characteristics in historical simulations. Detailed backtesting results and methodology documentation are available for review under a Non-Disclosure Agreement."
Disclaimer: Past performance is not indicative of future results. All trading involves risk.
Asset Classes Tested
1940 - Present
Forex - Major Pairs
2000- Present
Cryptocurrencies
2017 - Present
Futures - Commodities
1990 - Present
Gaining an Analytical Edge
CYCLE X is designed for sophisticated quantitative traders, hedge funds, and institutional investors seeking novel sources of alpha and enhanced risk management tools.
Signal Generation
Identifying potential high-probability entry/exit zones.
Strategy Confirmation
Adding conviction to existing trading signals.
Risk Management
Highlighting potential areas of market reversal or volatility expansion.
Factor Input
Integrating CYCLE X outputs into broader quantitative models.
"We are prepared to discuss various integration methods, tailored to your firm's infrastructure (subject to agreement)."
Discuss Integration & Pilot Programs
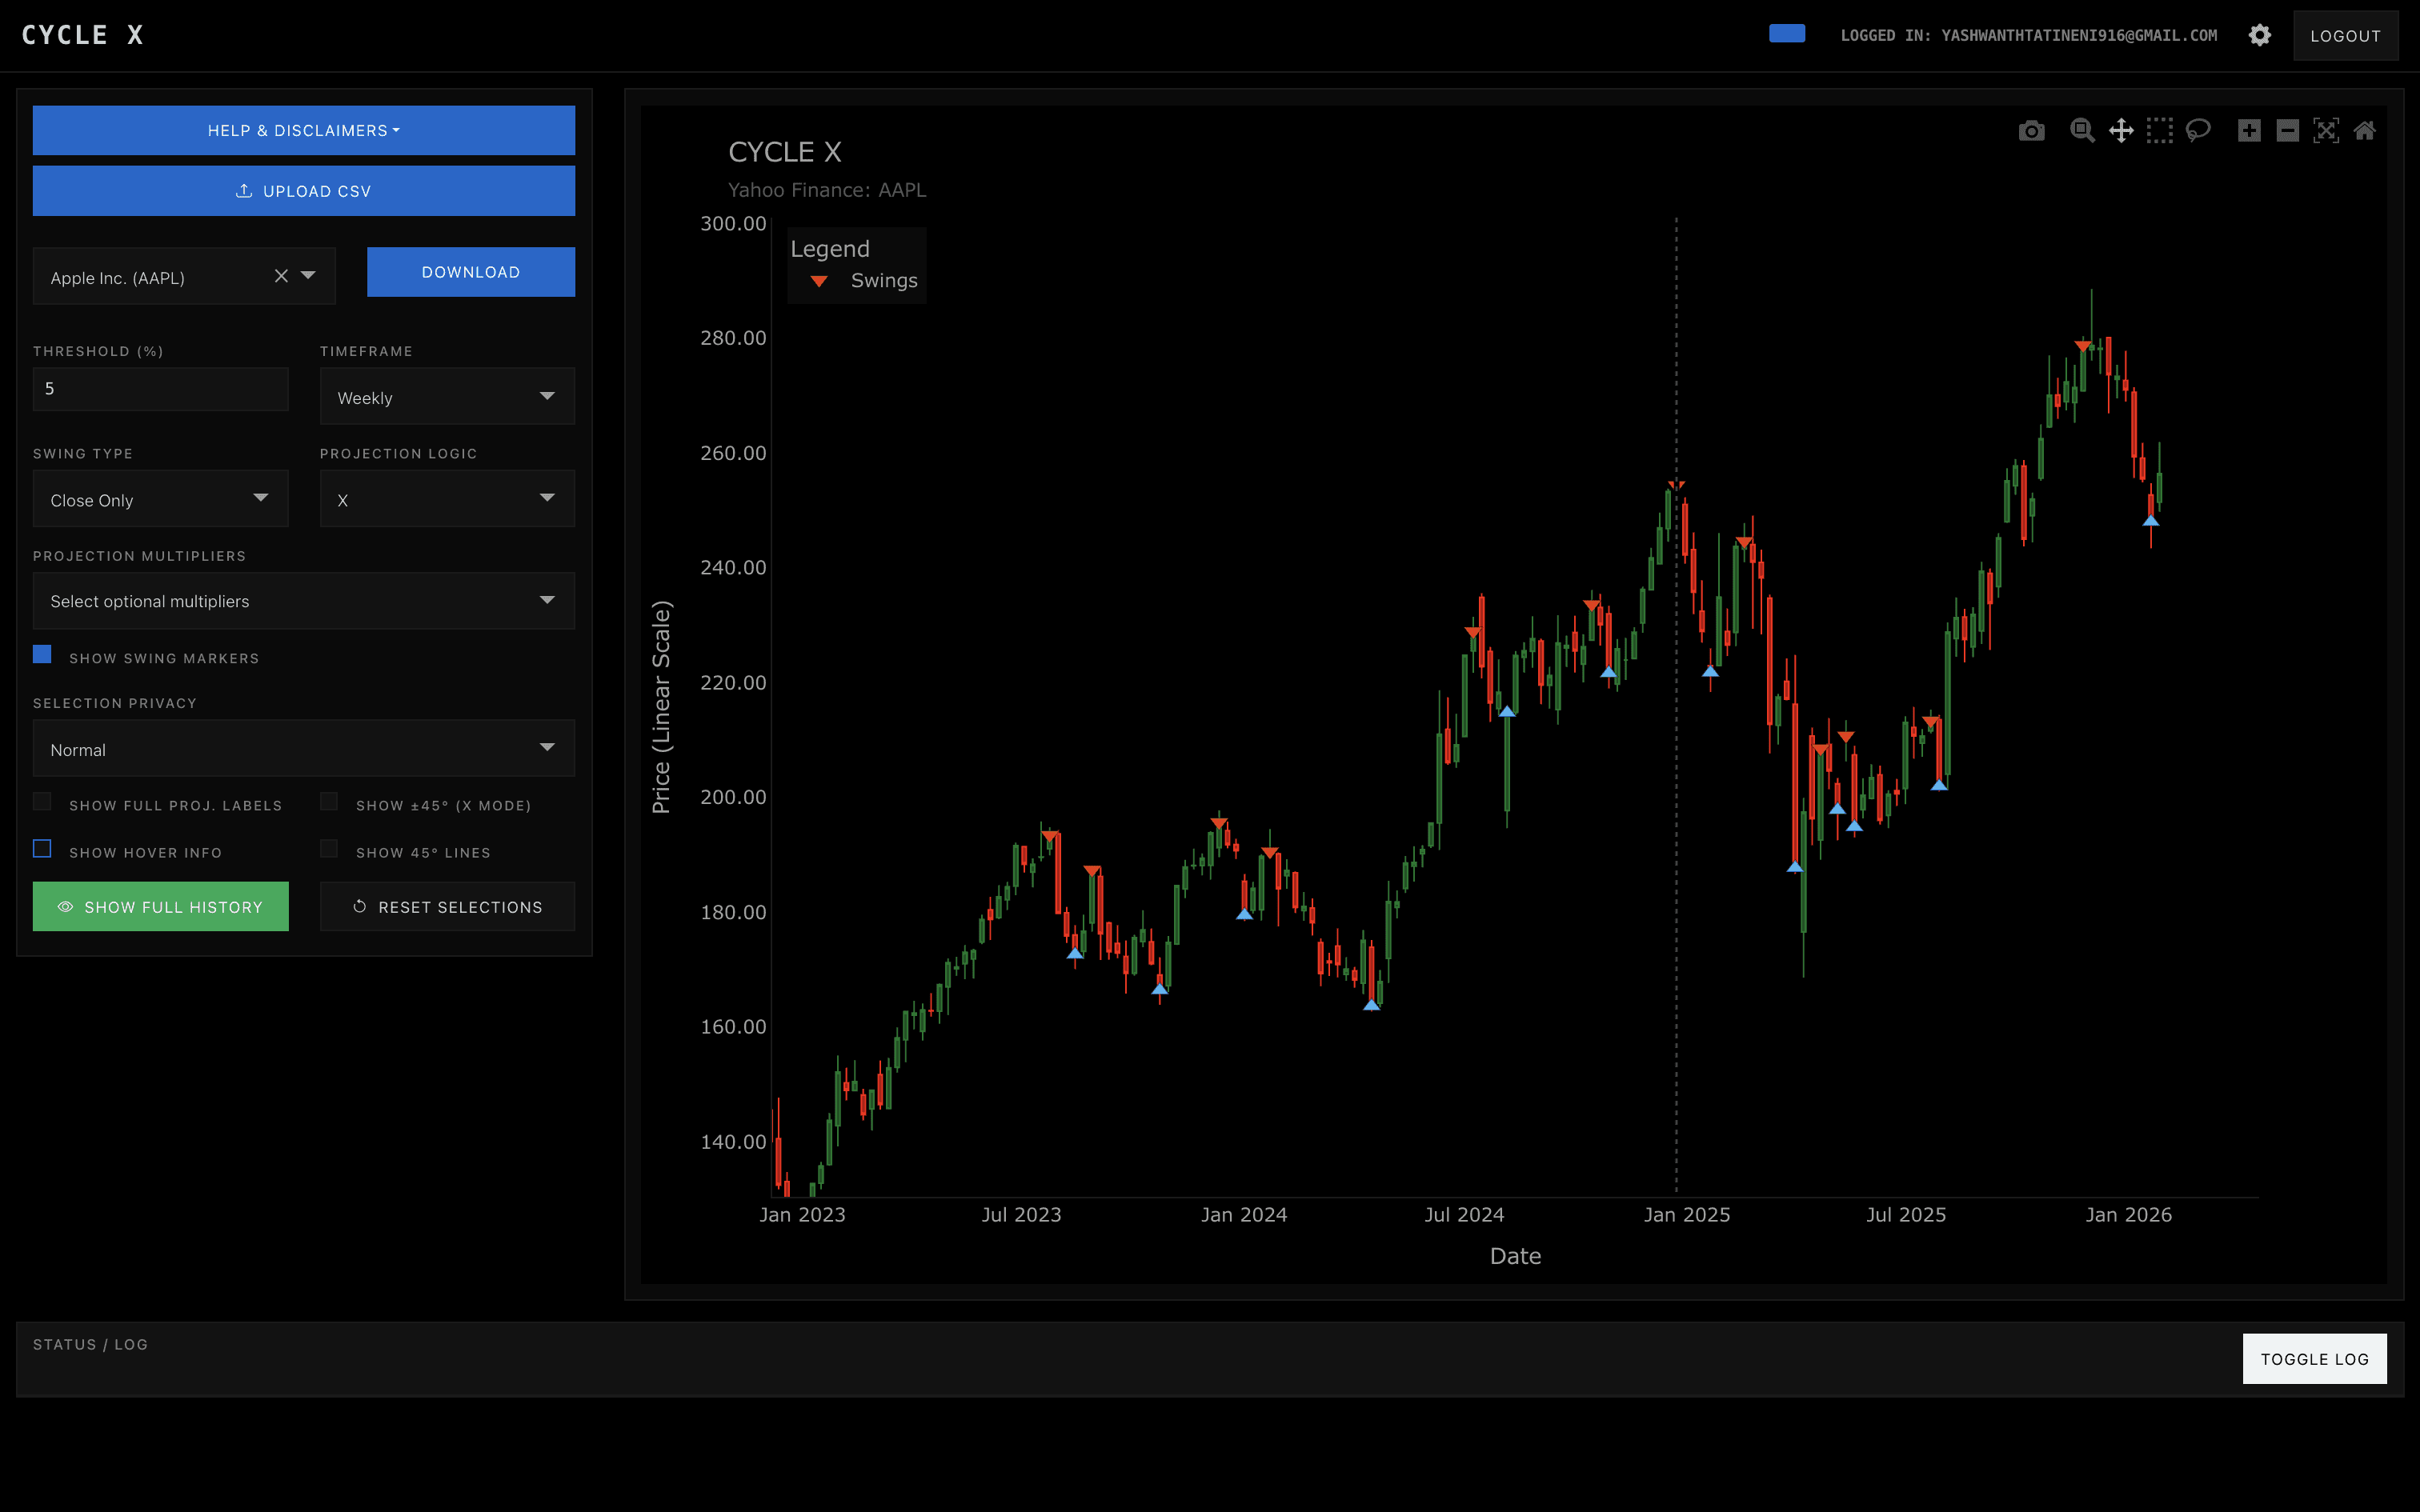
CYCLE X Dashboard
Interactive visualization of the CYCLE X harmonic analysis engine. View market cycle detection and projection capabilities.
Status / Log
Analysis complete. Apple AAPL Historical Data (1).csv processed successfully.
Detected 16 significant swing points with threshold 5%.
Projections calculated based on harmonic relationships.
About the CYCLE X Dashboard
This interactive dashboard demonstrates the core capabilities of the CYCLE X model, showing how our proprietary algorithm identifies swing points and calculates harmonic projections. The visualization represents historical data with detected swing highs (red triangles) and swing lows (green triangles).
The dashed projection lines represent potential future price levels based on the detected cycle dynamics. The "Proj1" projection indicates the first harmonic level, while the "Proj2" projection represents the second harmonic level.
Note: This is a demonstration dashboard. For full access to the CYCLE X analysis engine with your own data, please contact our team to discuss licensing options and integration possibilities.
Explore the Potential of CYCLE X
We invite interested institutional parties to engage in a confidential discussion to explore the CYCLE X model and its potential application within your strategies. Please contact us to schedule an introductory call and initiate the NDA process for access to detailed validation materials.